
| User Role | Chain | Chain Venue |
| Brand Manager | ✅ | ✅ |
| Chain Manager | ✅ | ✅ |
| Company Manager | ❌ | ❌ |
| Local Manager | ❌ | ❌ |
Number of Orders by Hour represents an average number of Orders per hour within a specified time frame. It is visually presented in form of a bar chart.
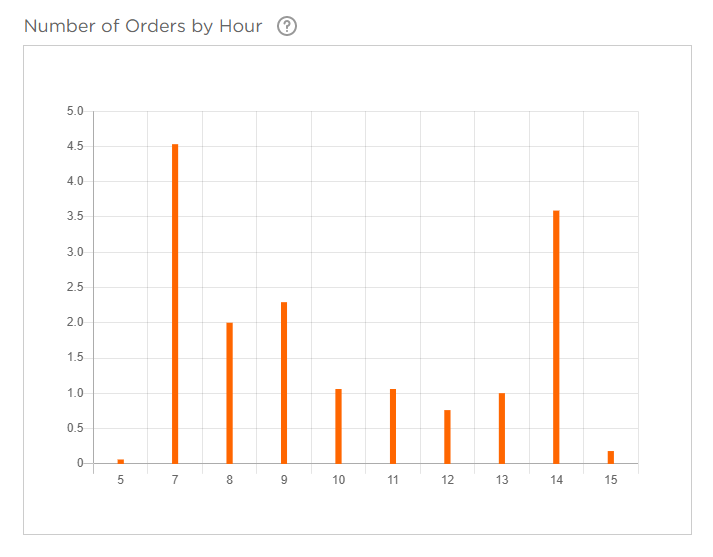
NOTE: If there are no Orders during some hours in the specified time period (e.g. after 15h/3PM in the screenshot above), those hours will not be displayed in the chart.
Bar chart
Bar chart visually presents Average Number of Orders per hour.
- Vertical axis: Number of Orders
- Horizontal axis: Hour of Order placement within specified time frame
If you hover over a bar which represents statistics for one hour, you get details about Sales trend (rising/falling). Trend is a result of comparison of Average Number of Orders placed on that specific hour during the time period defined in the Timeframe filter and the one defined in Compare to filter (e.g. Average of all 9h/9AM Orders of this month compared to Previous Period), displayed per Time Unit (defined in Time Unit filter).
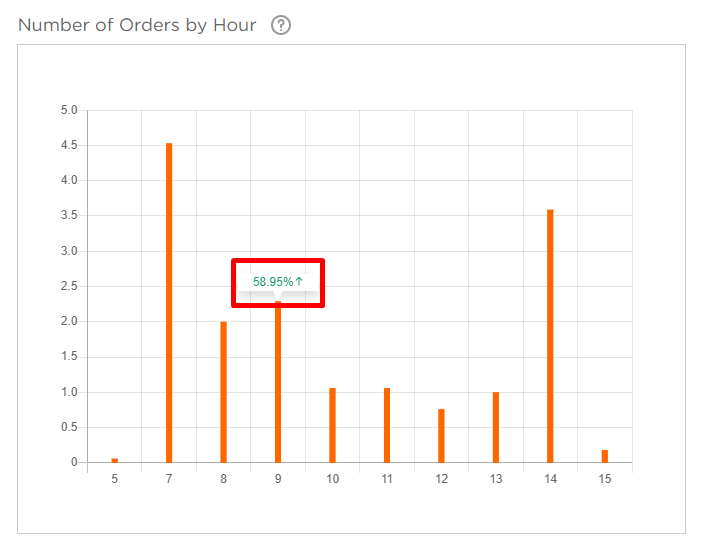
For more information on how these filters interact, please check out How to use Brand Performance Statistics? article and Timeframe and Compare to filter interaction table.
Comments
0 comments
Please sign in to leave a comment.